44%
Fewer absences
5th grade · 2025–26

Impact
Explore the attendance changes, family participation, and opportunities for leadership reported by Let’s Rise Above. Each school year tells its own part of the story.
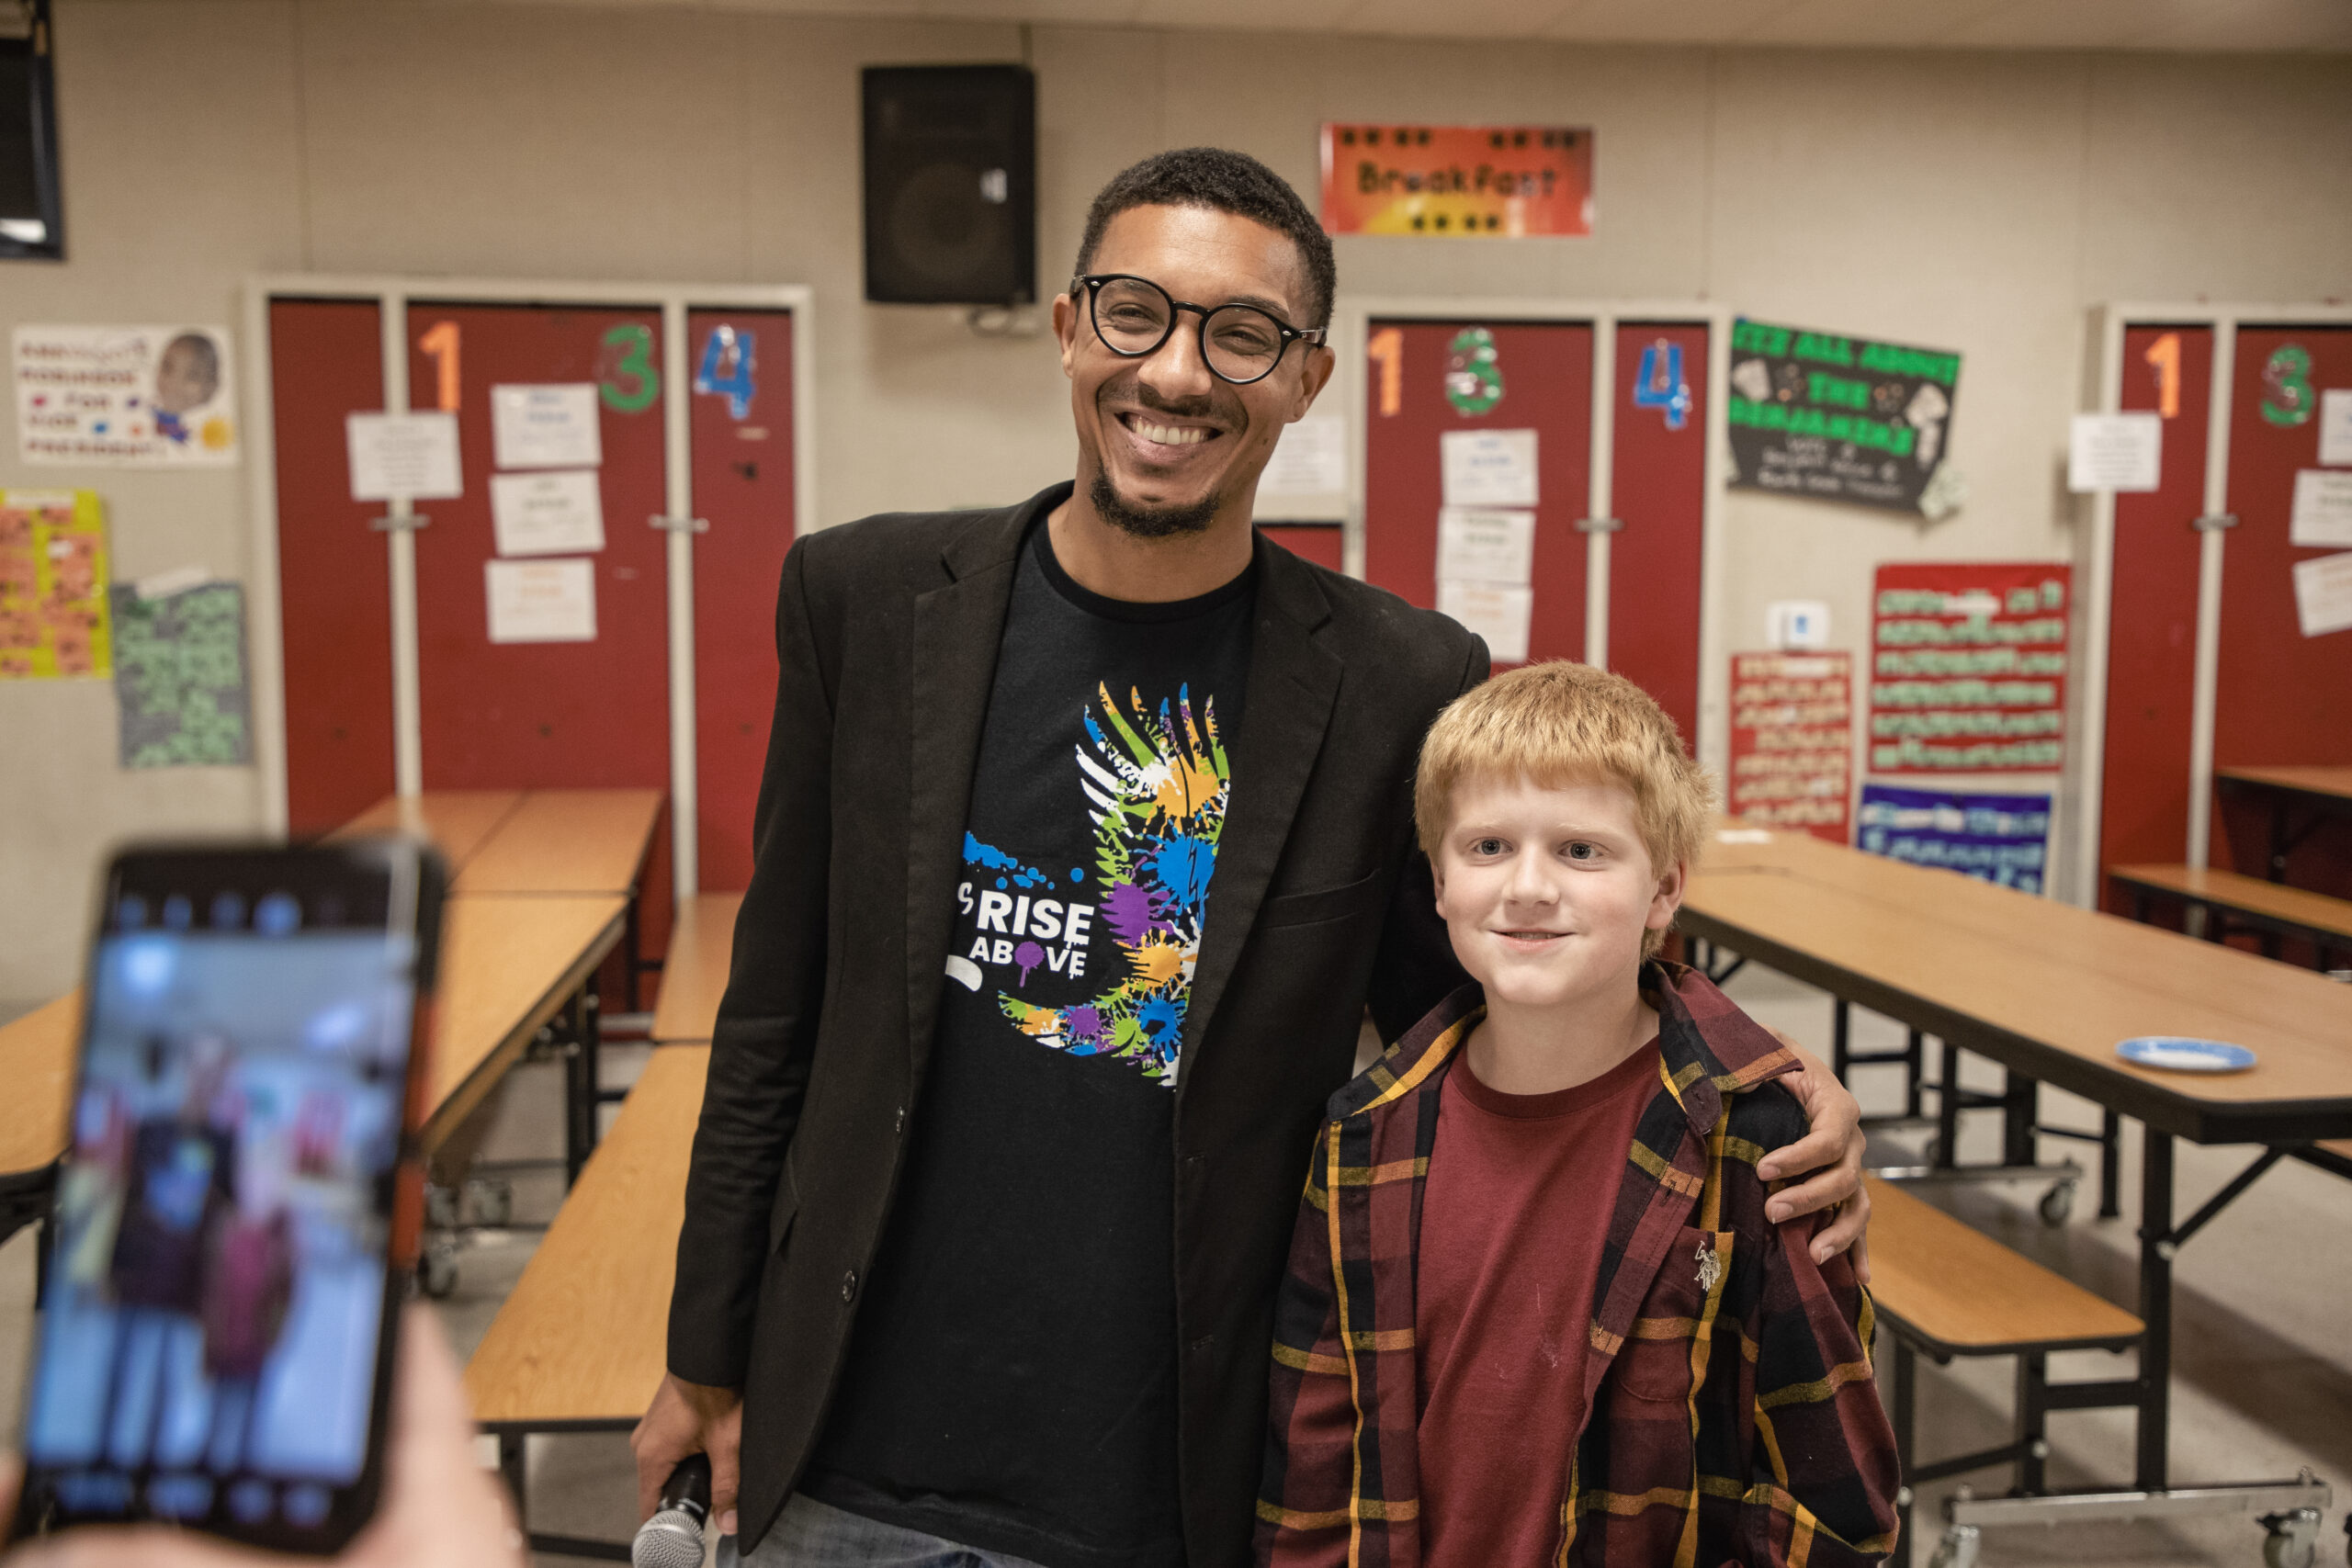
The people behind the work
Hear from Dr. Valdovinos, identified in this video as Assistant Principal at San Jacinto Elementary, in a year-end reflection on the Let’s Rise Above mentoring program.
Meet one of the school voices behind the work, then explore the reported results below.
1 minute, 55 seconds · Press play to watch here.
2025–26
75 participants, including 56 full-time participants.
5th grade · 2025–26
4th grade · 2025–26
1st–3rd grade · 2025–26
58 5th-grade parent/student success conferences.
4 parent workshops.
13 student volunteers from SJLA and 5 mentor/tutor training sessions.
1,000 meals provided internationally through student service.
2024–25
Fewer absences
More time using i-Ready
Fewer absences
More time using i-Ready
i-Ready time describes platform usage, not a change in test scores.
2024–25 parent ratings on a five-point scale.
Earlier community service examples, presented separately from 2025–26.
Support for a local pantry.
Support for children in the Philippines.
These figures are reported by Let’s Rise Above. Student groups and school years are shown separately; attendance changes, activity counts, platform usage, and parent ratings measure different aspects of the work.
These summaries do not include attendance comparison baselines, survey sample sizes, or detailed reporting methods. They should not be read as a controlled evaluation of the program.
The existing program summary also reports 93% average daily attendance, compared with 86.4% schoolwide, and a change in behavior incidents from 59 to 10.
A specific year and comparison period were not provided for these figures. They are kept separate from the dated results above.